Mapping the Movement: Producing maps of squatted social centres in Western Europe
This text was produced by people working on a project mapping squatted social centres at maps.squat.net.
Mapping the Movement: Producing maps of squatted social centres in Western Europe
Introduction
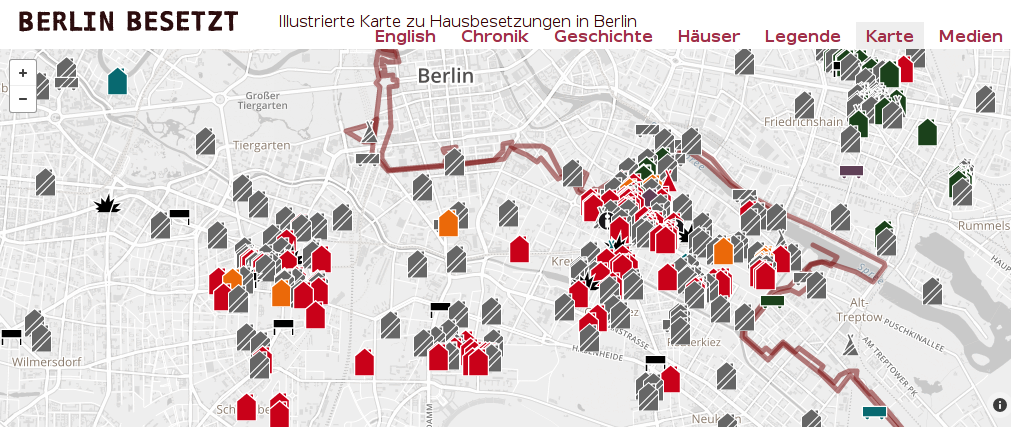
In 2013, a group of activist historians came together to map the history of the Berlin squatters movement in a digital and interactive way. They write on the concept of mapping the movement: “Because the claiming of urban space is the central theme in squatter movements, its history must also be presented in a spatial way.” The goal of the Berlin group is “to make visible” the self-managed and collective spaces that the city holds and held, and to make “traceable the development and spatial expansion of the movement.”
Needless to say, they did an impressive job. Their website offers a near-complete overview of squatted places in Berlin from 1970 onwards, and provides an enormous amount of information and material on individual squats. Not only does the Berlin map offer an amazing number of entries, the website also offers photos, scanned documents, a chronology of events and information on events and organizations that are linked to squats, such as demonstrations, infoshops and the like.
Naturally, such a project requires an enormous amount of work and coordination. The Berlin group got their data from movement publications, newspaper articles, interviews with activists and archival research. As they write, this endeavour translated into “several years of self-supported research,” as the thus gathered data was “entered meticulously in ever more extensive excel-sheets.” As this kind of research was done by several persons simultaneously, commitment and communication was essential.
The website of Berlin Besetzt is meant as a valuable tool for both historical research and reflection by activists on the history and present of urban social movements. Interestingly, the Berlin group reflects on this issue in a dual way. As a group, they believe that mapping the movement historically poses a political intervention, as it shows “that there were and are possibilities to intervene.” On the other hand, they quote “older activists” who told them that it would be “nonsense” to spend so much time studying the history of a movement that has “failed and disappeared.”
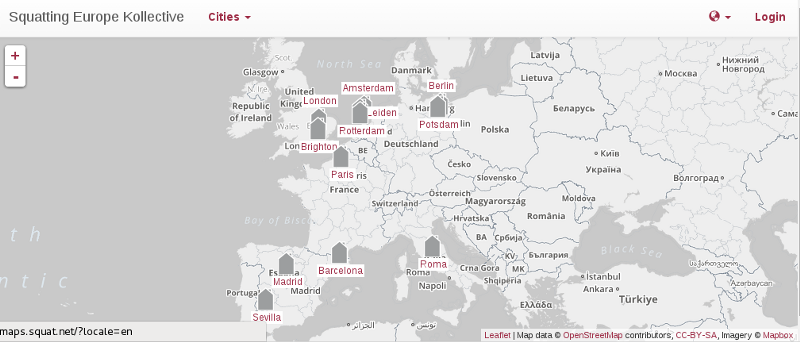
Both issues mentioned above, commitment and communication to a project and the question if mapping a movement poses a political intervention or if it is just plain “nonsense,” were to play an important role when other groups set out to follow the example laid out by Berlin Besetzt. As soon as other activists and academics got to see the map, they wanted to do something similar. This, then, is where the Squatting Europe Kollective (SqEK) comes in.
SqEK is a group of activist researchers working on the squatting movement. As the research agenda (available in EN/ES/FR/IT) states: “Our aim is to produce reliable and fine-grained knowledge about this movement not only as an end in itself, but also as a public resource, especially for squatters and activists. Critical engagement, transdisciplinarity and comparative approaches are the bases of our project.” The collective represents a broad group of researchers, coming from different disciplines and focusing on different fields of interest. While some may focus on the political history of squatting, others aim at developing sociological analyses of present squatter scenes, while yet more may prefer looking at squatting from a philosophical or cultural perspective. The group’s strength lies exactly in its focus on stimulating interaction and crossovers between these different approaches.
The collective organizes annual conferences and has authored various books and edited volumes. It also provided the inspiration for a comparative research project on squatter movements in twelve European cities. Under the banner of MOVOKEUR, the research project aimed to analyze the contexts in which these movements thrive, the development of protest cycles, processes of institutionalization, and the ways in which identities are shaped through and subsequently influence these movements. Graphical representations of some of these themes are online.
The project’s point of departure was to first draw up databases on squatted social centres in these twelve cities. This would then provide the raw data for further analysis. This has provided the basis for individual case studies as well as comparitive studies, which will be published by Palgrave Macmillan in book form in 2017. Already, databases and articles written about the data are available online.
However, whilst data on squatted social centres in various cities was being gathered, compiled and processed, it soon seemed only logical to visualize the thus produced datasets through digitalized, interactive maps. As such, it was an unplanned but very welcome spin-off from the original MOVOKEUR project. Yet, this step was only made possible through the inspiration provided by the Berlin Besetzt website and their sharing of expertise, as several Berlin Besetzt researchers are also part of the SqEK network.
Even so, the SqEK mapping project soon developed a dynamic of its own. True to the core ideas of the collective, the mapping project was organized from the bottom up. Thus, there is no central coordinating body, guiding or steering the project overall or managing the mapping of individual cities. New groups and individuals can apply to join the project and start mapping the city of their choice. The MOVOKEUR project stands at the heart of the effort, and therefore several cities are pretty well mapped. At the same time however, other cities are far from complete. This situation is directly related to the way the project is organized. As new people join the project, they are free to map “their” city in their own way and at their own speed.
Since the various contributors are dotted around Western Europe, it can at times be hard to keep in touch and properly organize collective efforts. Similarly, discussing certain issues can be hard to do via group email. Inherently, some will not feel addressed individually by an email that is addressed to all. This issue links back to the previously mentioned topics of commitment and communication.
As SqEK forms a transnational collective, the issue of language also plays a role in this, both because English is the dominant academic language whilst being the native language of only a small minority in the group and because the MOVOKEUR project was split between Spanish-language researchers working on cities in the Spanish state and researchers communicating mainly in English who were working on northern European cities.
Although the bottom up structure lends the SqEK mapping project its vitality, there are also certain downsides. First of all, because of the above, many of the SqEK maps cannot (yet) claim completeness in the same way Berlin Besetzt does. The web developer only added the possibility to upload photographs in May 2015, when the MOVOKEUR project was officially coming to an end; as a result, some cities such as Amsterdam, Barcelona, Brighton and Madrid do not have uploaded visual documents since the work was finished before the possibility existed and no more economic resources were available to take the work further.
As communication between the different mappers is not always optimal, this creates a risk to the uniformity of the data (and data processing) that stands at the basis of the mapping process. For example, different cities often use different time frames for their mapping projects, while there are also different views on the kinds of squats that should be mapped. While most projects focus on primarily mapping squatted social centres, others have chosen to also include residential squats.
Finally, and certainly not least, the SqEK maps do not yet possess the visual appeal of the Berlin Besetzt website. The maps were supposed to be produced by the developer at a quality resembling the Berlin map, but this is clearly not the case yet. Berlin Besetzt has more features and overall looks a lot prettier. This is of course crucial for a project that sets out to make the various squatter initiatives “visible” as the Berlin group stated it.
To better understand the challenges to the SqEK mapping project, and think of effective ways to move forward, it is vital to gain a better overview of how the SqEK collective works in practice. Considering the significant autonomy of the individual mappers, and staying true to the bottom up approach of SqEK, this issue translates to questions regarding the individual mappers. What kinds of challenges do they encounter when mapping “their” cities? How do they see these challenges, deal with them and reflect on them? These questions will stand at the heart of this chapter, where we focus on the individual projects making up the SqEK mapping effort. In a concluding paragraph, we will reflect on the more general conceptual issues that are brought up through the mappers’ individual experiences.
The process of mapping
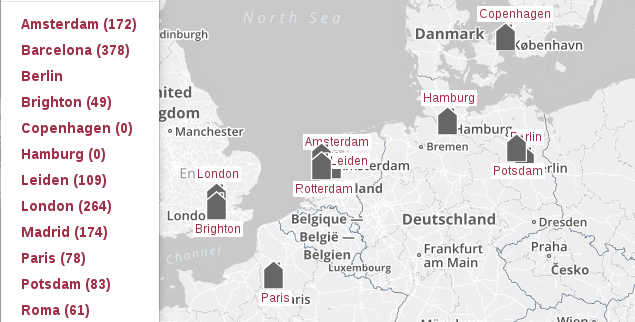
The website at maps.squat.net at present features finished city maps from Amsterdam, Barcelona, Brighton, London, Madrid, Potsdam and Rotterdam. Information for other cities such as Copenhagen, Hamburg, Leiden, Oslo, Paris and Seville is still being added. The first mentioned maps are considered finished in that the researcher(s) have completed the input of data.
Of course, a project such as this is never fully finished, since there will always be new squats to upload. Furthermore, ever more people are adding squats from the past. This process is facilitated by an added feature (a comment form), through which people can anonymously add squats. This feature builds forth on the bottom up approach of SqEK, and it is hoped that in this way crowd-sourced information can become a vital part of both old and new maps.
Even so, at present cities are being mapped by individuals or groups. Upon request, most of them have answered to our call and sent us brief reflections on their experiences. In the following, we will cite the experience of those who are mapping the following cities: Amsterdam, Barcelona, Brighton, London, Madrid, Paris, Potsdam, and Rotterdam.
In doing so, we will focus on specific questions, such as
1.) What kind of sources did you use, and in what way did you process the information that you gathered?
2.) How do you define the squats that you are mapping?
3.) Is your map complete, is your project finished?
4.) How have you experienced the process of mapping and what effects did it have on you or on your environment?
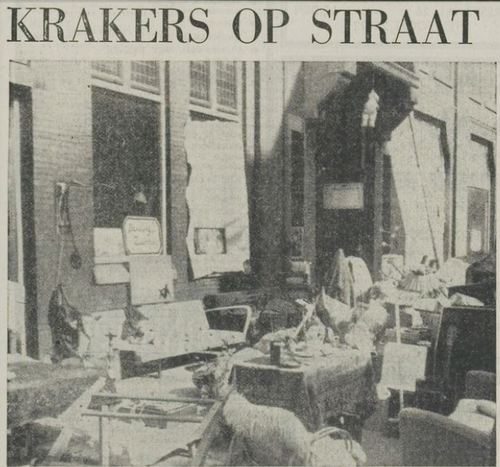
Amsterdam
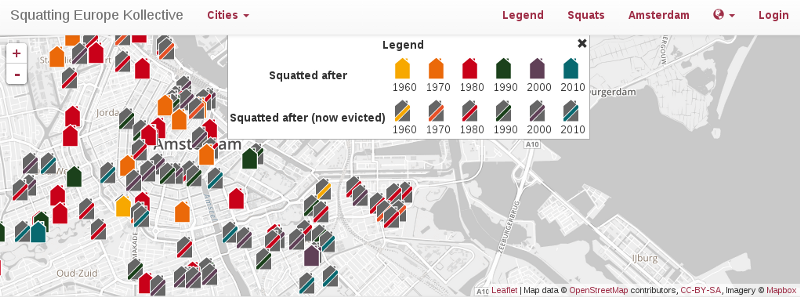
With 171 projects listed from the 1960s to end 2013, Amsterdam is far from finished. I spent the best part of a week at the Institute for Social History (IISH) in Amsterdam, devouring information and reading all the Grachtenkranten, the squatters’ newspaper which counts over six hundred issues and lasted from 1979 to 2008. Still, I could have done more. Not living in Amsterdam meant that my research was hampered, although several people did help out a bit.
There is one thing that is really brought out by the map. When you untick the ‘all years’ box and drag the timer slowly from year to year, you will see the number of projects from the 1970s and 1980s that are still in existence. Many of these project still adhere to radical politics and are still linked to the movement today. In doing so, they provide a massive amount of infrastructure and indeed form a sort of living history for today’s activists. By the simple fact of their continued existence, these places provide a huge boost to current struggles.
Barcelona
The Barcelona map covers the entire Metropolitan Area. It only includes squatted social centres. Residential squats are excluded. Due to their large numbers it would be extremely difficult to acquire a complete listing of them. In total, the map covers roughly six hundred squatted social centres, providing basic information on each of them (mainly the start and eviction dates).
Our data on squatted social centres from 1995 to the present has been drawn from the websites Info-Usurpa and Contra-Infos. These two tools made it possible to easily gather information on a large number of political squatting projects. For the most recent information, we were able to use the website 15mpedia.org as a source of information. For the period prior to 1995, we have drawn from bibliographic research and activist knowledge.
Due to various reasons, it has become increasingly difficult to map recent events and squatter actions. First of all, since the emergence of the 15M movement in 2011, the number of squatter actions has risen dramatically. Furthermore, communication within the movement is at times hampered by the movement’s heterogeneity. Not only are there differences between an old and a new generation of squatters, the same holds true for Catalan and foreign squatters.
Those who are interested can access the map and add new information. So far however, only one collective has posted an update on the original database. This may also be explained by the limited publicity that we have given on the map amongst activists.
Brighton

Mapping Brighton was fun to do in that I lived there and thus had access to people who had squatted in different times from the 1970s to the present day. This means that the map feels quite complete, especially since (compared to the other cities listed here) Brighton is not very large. Of course there will be projects still to be added.
London

Most people scoffed when I told them I was mapping squats in London, since the city is so vast and has experienced thousands if not hundreds of thousands of squatter actions since the 1960s. However, limiting the project to mapping social centres made the task easier, even if the result still needs much more input. So far, 263 projects have been inserted.
The information for the map was mainly gathered at the 56a Infoshop in Elephant & Castle, London. This is a rare long-lasting movement project, which has a large archive to trawl through. Their suggestion was to add photos of projects (then and now) which would be a great addition but also a lot of work. Surprisingly, the Institute for Social History in Amsterdam was also quite helpful in finding places from the 1980s, a decade for which the map is still far from complete.
Madrid
When we started our map, we could rely on the work done by others. One of them listed squatter actions until the mid-1990s, while others focused more on recent squats, for example okupa tambien, agita madrid and 15mpedia.
A problem with these sources was however that they were not complete and that many data inputs were wrong. We could verify much of the information and add new cases by checking squatters and mainstream news websites. Often, firsthand knowledge was crucial in checking data.
Our mapping effort sparked a group that from 2008 to 2010 met regularly to research and discuss the history of squatting in Madrid. These meetings among other gave way to a book publication.
Our database is limited to squatted social centers and covers the period from 1977 to 2015. This choice was informed mainly by the fact that information on these squats is more easily accessible and public. All of them are located in the metropolitan area of Madrid (municipality and region). In one case, a squat from a bordering province (Guadalajara) is included due to its active role in the 2008 campaign against the eviction of social centers. In addition, fourteen cases of occupation urban plots of land are also included. In most cases, regular squatters were involved in these projects, and many of these spaces functioned as a sort of outdoor social centers. In total, in covers 155 squats, although it must be noted that only eight are registered for the period between 1977 and 1980.
Residential squatted houses are generally excluded from the list. Usually, squatters do not recognize the residential function of a squat, because that entails more legal risks. Thus, researchers are not to mention the residential function of squats unless a prudent amount of time has passed. This applies specifically to the currently active squatted houses or the recent ones from the last 5 years.
In fact, less than thirty squatted social centers hosted residents. In some cases, the initial purpose of a squat was to provide a home. More often than, however, it was later decided to open up parts of the building as a cultural and political venue.
Paris
The map for Paris is not finished and currently under progress. The process is long. I work with a database of around 400 squats since the 1950s. I have collected the data for a research about squatting and urban policies between 2010 and 2015. The data were collected and completed through interviews with squatters or previous squatters for the most recent period, also helped by press reviews and analysis of websites documents (squat.net + Intersquat). For the oldest squats, I used works from historians (among others C. Pechu and B. Colin) and press reviews. For each squats, I tried to find informations for 20 variables about location, period, type of property, type of squat, relations with authorities, with neighbours etc…
But the database is not exhaustive and focus too much on the Paris centre and its closest suburbs while there are / were also many squats in the suburbs. Besides, most of the squats in Paris (as in most of the European Cities) are invisible and cannot be considered as social centres. They are rather residential squats where different kinds of population live, mostly very precarious, in Paris and its Northern suburbs. I have an aggregated database (by Departments) and I won’t put them in the SqEK Map. We can estimate that there are more than 3000 squats of this kind in the Paris Region.
A map is an important resource for both sides. Statistics and maps are tools for power: governments can build and analyze database in order to control the population. However, social movements and resistant can also use this tool as a way to resist and develop an alternative knowledge on the history of squatting for example. Thus, the issue is to turn this map into a tool for resistance. Among many debates we had with SqEK members and other activists, I found the idea of mapping only squatted social centres that have been closed very interesting. The issue is important. On the one hand, it is necessary to respect the will of collectives not to be visible on the map. On the other hand, this work could be part of a process of memory building for social movements.
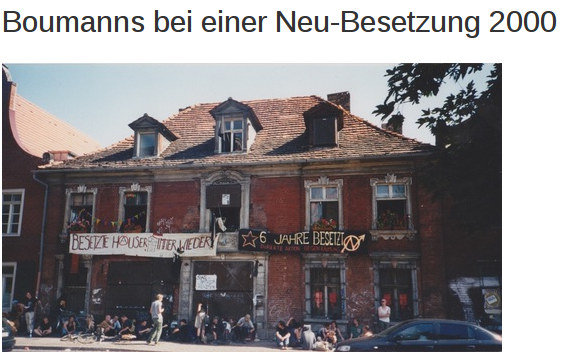
Potsdam
The map is almost complete and documents the history of squatting in Potsdam between 1985 and 2006. In the beginning of the 1990s, Potsdam was a centre of the German squatting movement.
It was not easy to find all this material. There was no coherent collection of information about this local phenomenon, the relevant sources were scattered in different places. The sources of this collection are newspapers, different archives, flyers from the movement, interviews with squatters, movie clips, pictures… . A lot of former squatters gave me their collections of material and supported this project.
Some houses have a description, for a lot of buildings background information was not found.
I added a short history of squatting and tried to explain squatting from a historical perspective. A central point in this contribution is the system change 1989/1990 where public squatting was born. I try to show the main lines of development and the connection between squatting in the time of GDR and the practice of squatting after the fall of the Berlin wall. I think the map makes it possible to show the diversity of squatting, local concentrations, spaces of public struggles and more.
Rotterdam
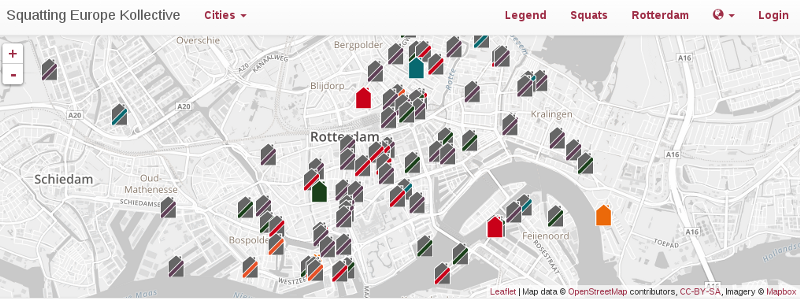
Rotterdam has a largely hidden and underground squatting history, so it was a question of pretty much starting from scratch with the research. Since I had squatted in Rotterdam in the 2000s I had some leads and one squatter from the 1980s was very helpful. Otherwise people were supportive but were either not very interested to spend time adding places or could not remember much coherent info from their days of squatting. The city archive had a limited amount of information but what revolutionised the search was the tip from the Leiden mappers to use delpher, a website which facilitates the online search of digitised newspapers from the 20th century in a very easy format. I thus began a second phase of research (which is still ongoing) in which I am discovering the squats of the 1970s and 1980s. Whilst some people undoubtedly know about this since they were participants at the time,for me it is all totally fresh. I’m reading about the Phoenix Motorclub cracking a series of places for their workshop space, action groups occupying buildings for gastarbeiders (foreign migrant workers), communities protesting emptiness and dereliction, the people of Spangen reopening their baths, artists providing themselves with atelier space, punks smashing up the ABN AMRO bank after an eviction, kids in the south squatting youth centres and police shooting at demonstrators during the eviction of a former bicycle factory.
It is very exciting to discover all this new information and the map is currently being used as a repository for data which will then be utilised for a separate project to produce a book about squatting in Rotterdam.
Hopefully recording all these projects will help contribute to a broader awareness of how squatters have shaped the city of Rotterdam. Unfortunately, as the map shows, there are not so many current projects. Nevertheless, it brightens up my day as I cycle around the city to see places which I have just inputted on the map and to see what function they have now.
Moving forward
The maps we have produced, through hours of labour, have the potential to be a really useful activist resource. Over time, hopefully crowd-sourced data will improve them and make them more complete. Despite the difficulties engendered through varying approaches, a disinterested developer and the transnational nature of the collective, the maps form a delightful means to feed our academic work back into a more activist function of radical history, since many more people will see the maps than read the articles and databases.
The mapping project aimed at presenting the history of squatting in an easy manner to access and navigate for past and new activists. Compared to academic articles the maps, pictures, locations, short texts and links open up more ways to delve into that history. They also provide indications to compare cities and urban areas within cities. A map is just a tool to facilitate access to information and to produce knowledge, although all the political implications are responsibility of those who interpret this information. Squatting projects tend to be omitted, stigmatised and misunderstood, so the maps contribute to the public debate about it. As a collaborative tool open to suggestions from visitors to the webpages, it bridges the activist scenes and the SqEK in a supplementary fashion to the meetings, talks and publications we also produce. Given the complexity of the technical aspects involved (new icons for the legends, implementation of queries, scales, different languages, etc.) and the social networks of people involved (those collecting data, those entering in the maps, those maintaining and updating, etc.) the project is for sure a work in progress that need to be enhanced in the coming years and, perhaps, linked to similar ones.
Finally, as one would expect, there were concerns for many about the utility of the maps for the state and other repressive organisations, an issue which has occasioned much debate. There is no easy answer here and different cities approached the maps in different ways. One approach was only to profile social centres, defined in a loose sense as politically active squats open to all, which therefore already had a public presence. Thus these places were already present in the media and often had websites, so the maps are not so much revealing anything as collating data already available. Otherwise one city was requested to be taken off the database since participants in the local squatters movement decided they would rather not be profiled in an online, publicly available map.
As can be seen from the individual accounts above, people are using the mapping project in different ways and new research opportunities are the result. The process is ongoing. Within this, there are still of course questions to be answered, for example:
What can we usefully say with this kind of visualisation?
Can we represent connections and relationships between the different local movements in Europe?
How could the maps grow?
Written by (in alphabetical order):
Thomas Aguilera
Claudio Cattaneo
E.T.C. Dee
Miguel Martinez
Bart van der Steen
Jakob Warnecke
Images are either screenshots taken by the authors or documents with link supplied